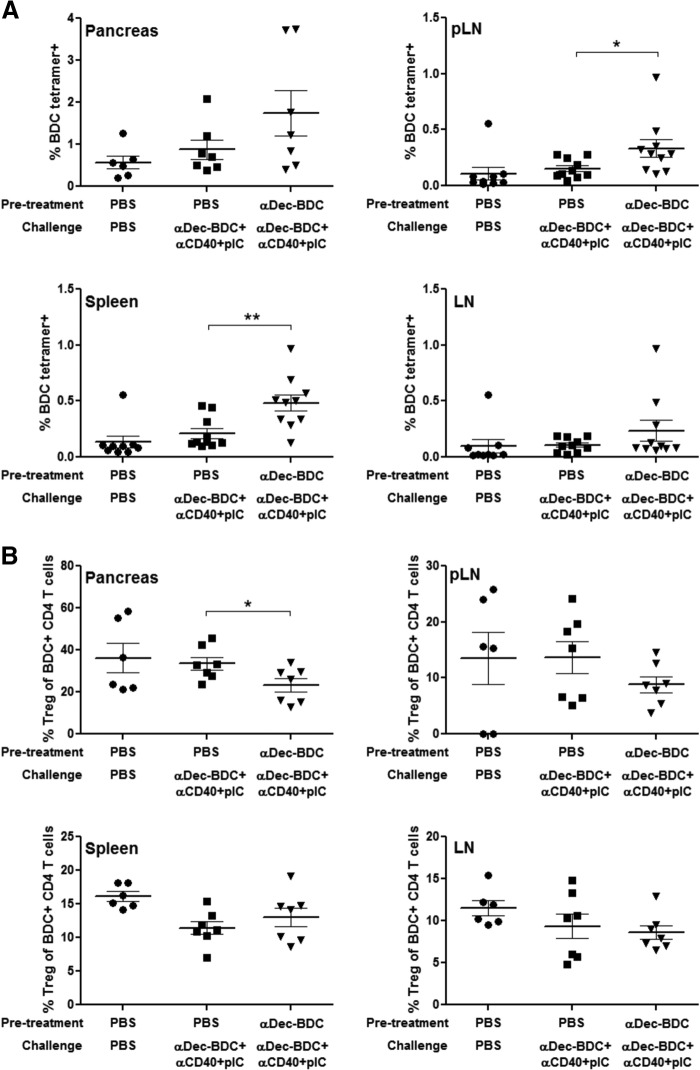
Figure 6. αDEC-BDC fails to induce tolerance in endogenous CD4 T cells.
NOD mice were injected with PBS or αDEC-BDC, followed by a challenge with αDEC-BDC plus αCD40 and poly(I:C) 7 days later. Three to 4 days following the challenge the pancreas, pLN, LN, and spleen were analyzed for the percentage of BDC/I-Ag7 tetramer-positive cells among CD4+ T cells (A) and the percentage of Tregs (FoxP3+) among tetramer+ CD4+ T cells (B). Each point represents data from a single mouse; data compiled from two or three independent experiments. *P ≤ 0.05; **P ≤ 0.005.

