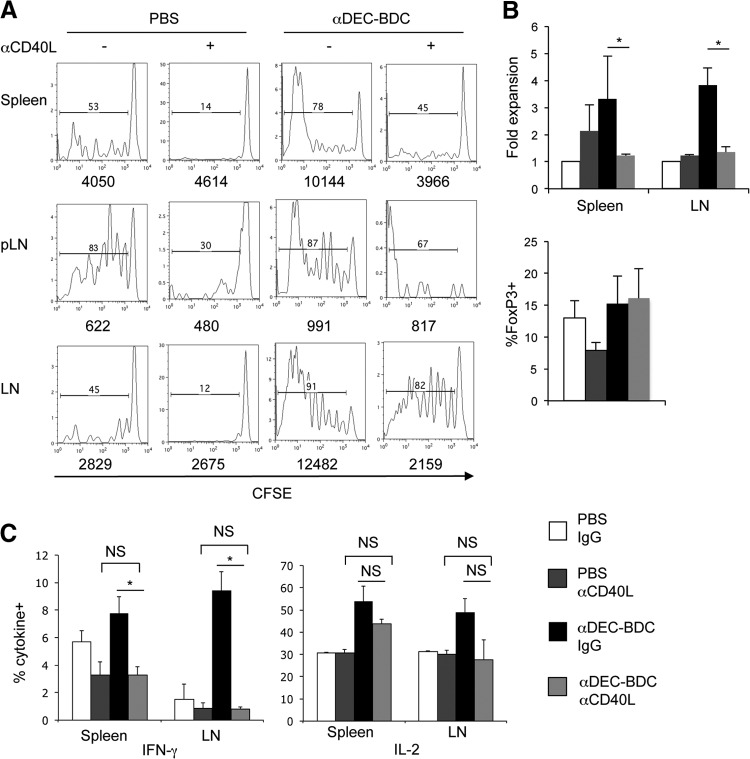
Figure 8. Inhibiting CD40–CD40L interactions blocks T cell accumulation and cytokine secretion after stimulation by CD8+ DCs.
(A) BDC2.5 T cells were stimulated with PBS or αDEC-BDC and αCD40L or control IgG. Cells from lymphoid tissues were recovered at Day 10 and examined for cell number and proliferation. Numbers above the bar represent the percentage of divided BDC2.5 T cells, whereas numbers below the graph indicate the total number of BDC2.5 T cells in the lymphoid tissues. (B) Fold expansion of BDC2.5 T cells in spleen or LNs (upper) or percentage FoxP3+ of BDC2.5 T cells in spleen (lower) at Day 10 after the indicated stimulation compared with unstimulated cells with control IgG. Data are the average of three independent experiments + sem. *P < 0.05. (C) Cells from treated mice were assessed for IFN-γ and IL-2 production by intracellular flow cytometry. Data are the percent of BDC2.5 T cells positive for the indicated cytokines. Data are the average of three independent experiments + sem. *P < 0.05. NS, not significant.

