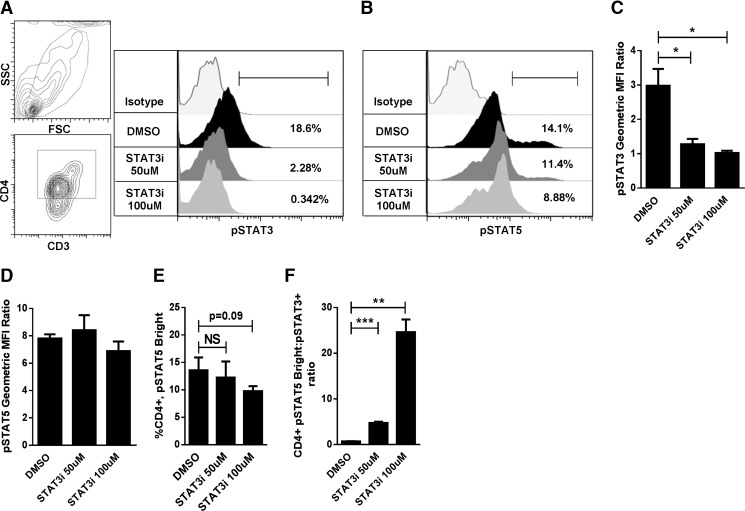
Figure 2. STAT3 inhibition with S3I-201 polarized STAT5 phosphorylation in allostimulated CD4+ T cells.
(A, B) Representative contour plots show gating strategy and histograms demonstrate reduced STAT3 phosphorylation in CD4+ alloresponders, with preservation of STAT5 activity, in 5 day allogeneic cocultures (DC:T cell ratio 1:30) treated with S3I-201 vs. DMSO without the addition of any exogenous cytokine. (A, B) Gates define the CD4+, pSTAT3+ and CD4+, pSTAT5Bright T cells, respectively. (C, D) The mean ± sd of results in 3 independent experiments of STAT3 and -5 phosphorylation by geometric MFI ratio. (E) the frequency of CD4+, pSTAT5Bright T cells, and (F) the CD4+, pSTAT5Bright:pSTAT3+ ratio by percentage of phosphorylation, in CD4+ T cells harvested from S3I-201- or DMSO-treated 5 day allogeneic cocultures. *P < 0.05, **P=0.001–0.01, ***P = 0.0001–0.001, NS, by paired t test.

