
Figure 6. STAT3 inhibition preserved CTL capacity.
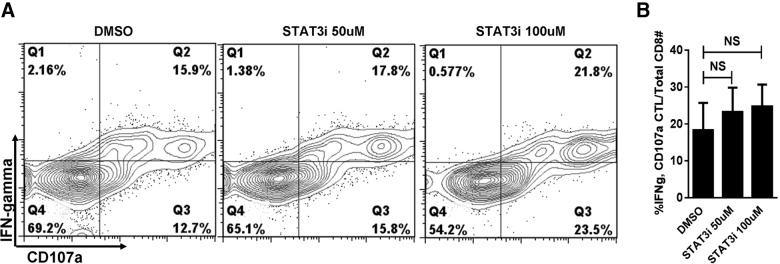
(A) Contour plots and (B) bar graph shows preserved CD8 CTL capacity by CD107a and IFN-γ expression, in S3I-201- or DMSO-treated allo-MLRs. Allogeneic cocultures (DC:CD8+ T cell ratio 1:30) were analyzed on day 5. Graph data are the mean ± sd from 3 independent experiments. NS, paired t test.