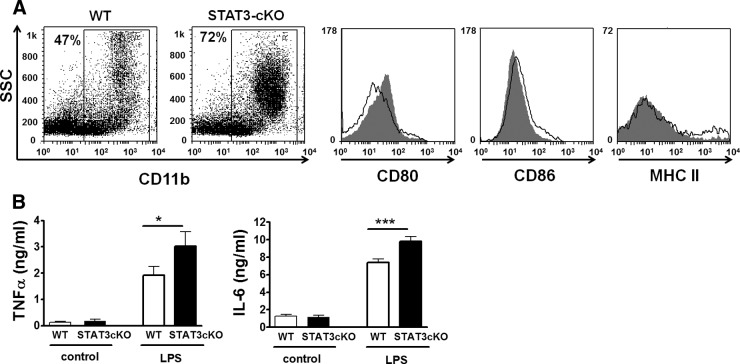
Figure 3. Specific reduction of STAT3 in myeloid cells leads to an enhanced proinflammatory phenotype.
A flow cytometry analysis of spleen CD11b+ cells from WT versus STAT3-cKO mice with CD80, CD86, and MHC class II markers (n=3). STAT3-cKO myeloid cells presented higher CD80, slightly reduced CD86, and no different MHC class II expressions. Representative FACS plots and histograms (white, WT; gray, STAT3-cKO) are shown. (B) In vitro response to LPS of peritoneal cells from WT versus STAT3-cKO mice. Cells were cultured in complete RPMI-1640 medium with/without LPS (100 ng/ml; E. coli), and cytokine content in supernatants was determined by ELISA. STAT3-cKO myeloid cells produced higher levels of TNF-α and IL-6 than WT cells. Student's t-test, *P < 0.05; ***P < 0.001. A representative experiment of three is shown.

