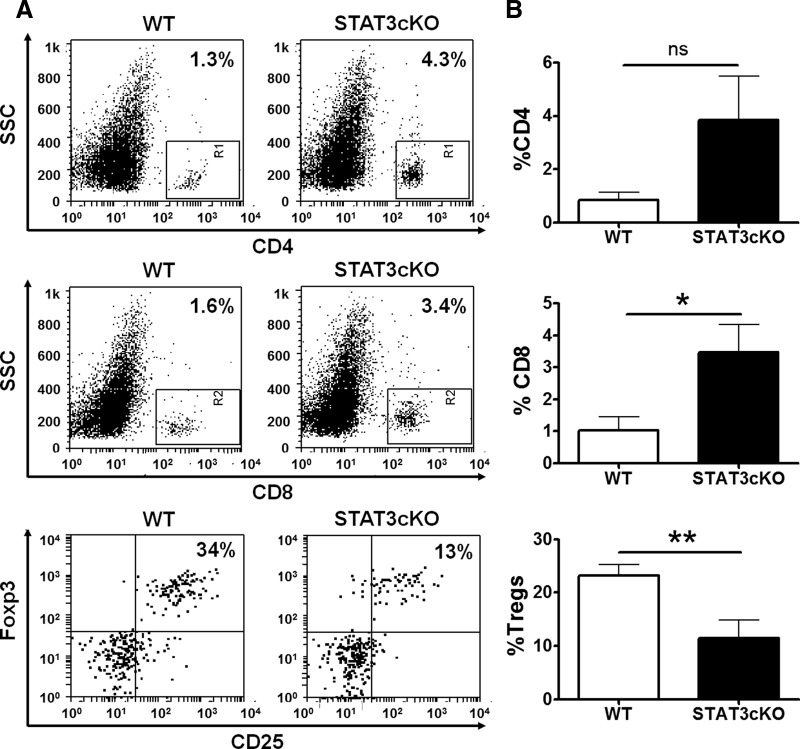
Figure 7. CD4+ and CD8+ cells are increased, but Tregs are reduced in STAT3-cKO mice compared with WT mice tumors.
The proportions of CD4+, CD8+, and CD25+Foxp3+ cells in Smo* WT versus STAT3-cKO tumors were determined by flow cytometry. For Tregs, cells were first gated on the CD4+ population. (A) Representative FACS plots and (B) the average proportions of these cells (n=8). Student's t-test, *P < 0.05; **P < 0.01.

