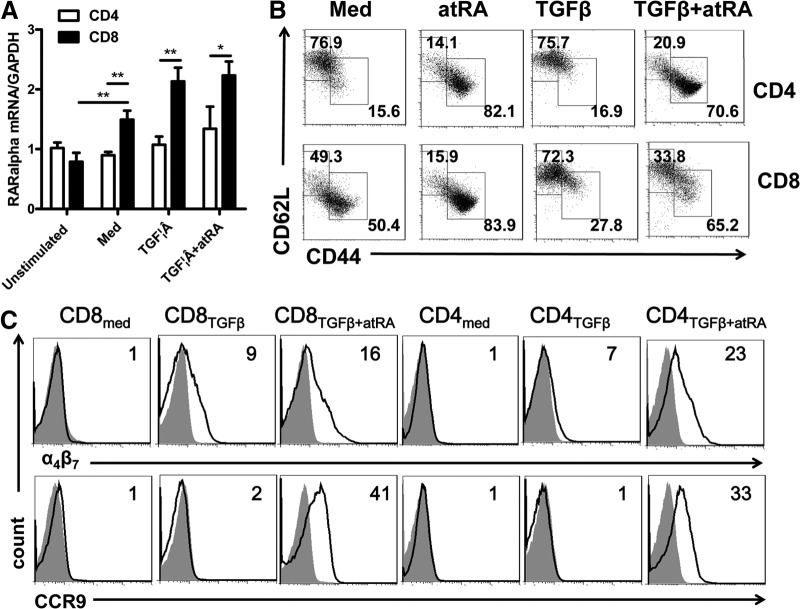
Figure 2. CD8+ cells had the same response to ATRA as did CD4+ cells.
(A) The expression of ATRA RARα mRNA was determined by quantitative RT-PCR on naive or activated CD4+ and CD8+ cells. These cells were activated with TCR and IL-2, with or without TGF-β and with or without ATRA. Data are the mean ± se of 3 separate experiments. (B) CD4TGFβ, CD8TGFβ, CD4TGFβ+ATRA, or CD8TGFβ+ATRA cells were induced as in Fig. 1A, and the expression of CD44 and CD62L gated on CD4 or CD8 was analyzed by flow cytometry. Dot plots are representative of 3 independent experiments. (C) The expression of α4β7 and CCR-9 on CD4med, CD8med, CD4TGFβ, CD8TGFβ, CD4TGFβ+ATRA, or CD8TGFβ+ATRA cells was analyzed by flow cytometry. Data are representative of 3 independent experiments showing staining (black) plus isotype control (gray).

