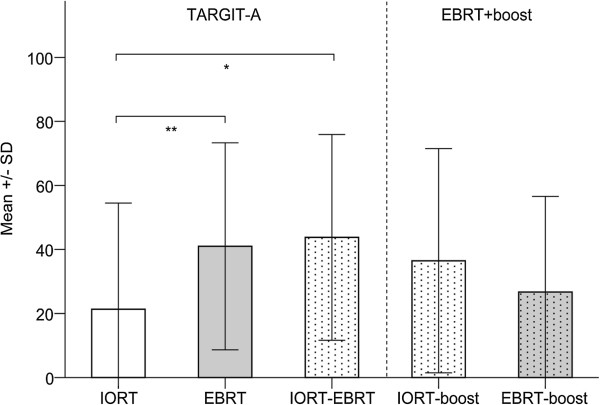
Figure 1.

General pain by treatment group as measured with the EORTC QLQ-C30. Higher scores are equal to severe symptoms/worse quality of life. Please note: Univariate regression analysis revealed no influence of follow-up duration on self-reported pain symptoms. Abbreviations: SD, standard deviation. * Mann–Whitney U-test. P = 0.018. ** Mann–Whitney U-test. P = 0.007.
