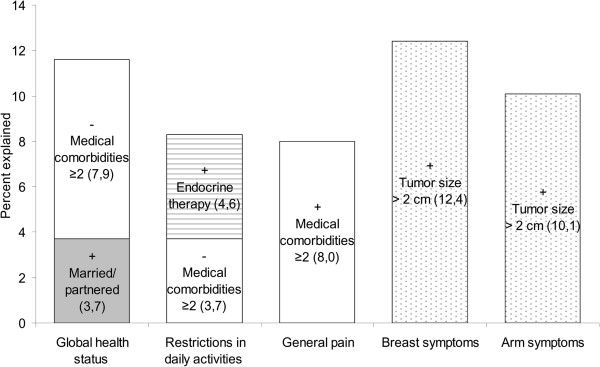
Figure 4.

Percentage of variance in the QoL parameters accounted for by demographic and clinical variables for the TARGIT-A group. The bars show the percentage of variance explained by multiple linear regression analysis for the QoL parameters examined. The number in brackets indicates the percentage of variance explained by each factor. The sign before each term indicates whether the factor was positively or negatively related to the QoL parameter.
