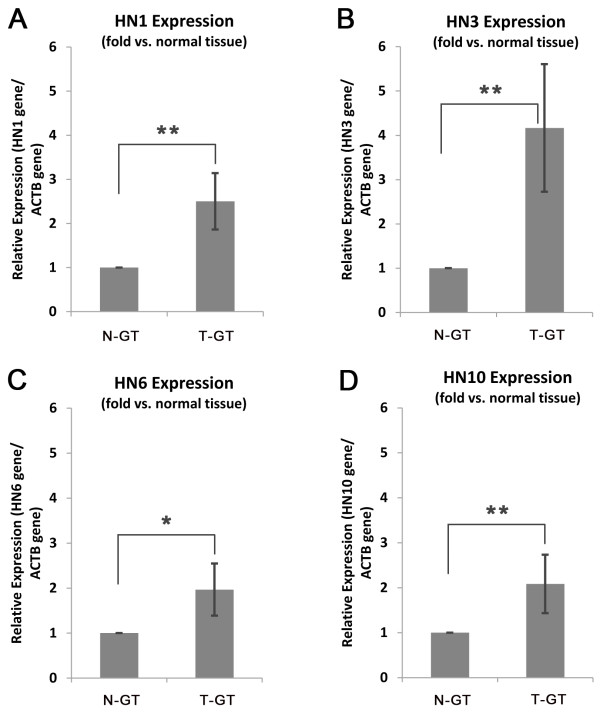
Figure 3.
Relative gene expression analysis of HN isoforms in normal and tumor tissue samples, using qRT-PCR. (A) HN1 isoform. (B) HN3 isoform. (C) HN6 isoform. (D) HN10 isoform. N-GT: normal gastric tissue, T-GT: tumor gastric tissue. Whiskers represent the STDEV of expression in samples (n = 10). *P < 0.05, **P < 0.01.

