
Figure 5.
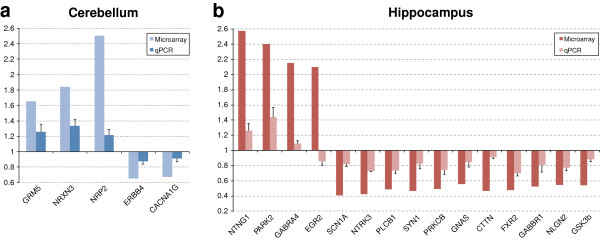
Quantitative PCR validation of differentially expressed genes. A selected number of differentially expressed genes in the En2-/- cerebellum (a) and hippocampus (b) were validated by qPCR. Relative mRNA expression level (fold expression) as obtained by qPCR performed on whole cerebellum or hippocampus extracts of adult wild type (WT) and En2-/- mice. Correlation of fold expression from qPCR (light color bars) and microarray (dark color bars) results was calculated using Pearson’s Correlation. Except for Egr2, qPCR results for all the evaluated genes showed significant correlation with microarray results (R = 0.84; P <0.05). Values are expressed as each gene/L41 comparative quantitation ratios normalized on the expression of WT (mean ± s.e.m of three replicates from pools of four animals per genotype; P <0.01, Student’s t-test, WT versus En2-/-.