
Figure 9.
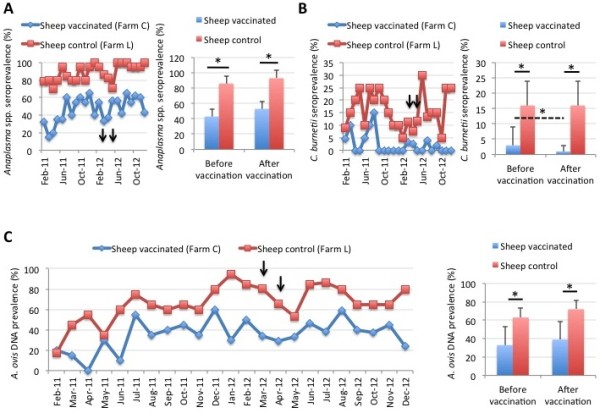
Prevalence of tick-borne pathogens in sheep. (A) The seroprevalence (%) of Anaplasma spp. in vaccinated and control sheep was determined by ELISA, represented as Ave ± SD and compared between sheep in the vaccinated farm before and after vaccination and between vaccinated and control sheep by Student’s t-test with unequal variance (*p < 0.05). The time of immunization shots are indicated with arrows. (B) The seroprevalence (%) of C. burnetii in vaccinated and control sheep was determined by ELISA, represented as Ave ± SD and compared between sheep in the vaccinated farm before and after vaccination and between vaccinated and control sheep by Student’s t-test with unequal variance (*p < 0.05). The time of immunization shots are indicated with arrows. (C) The DNA prevalence (%) for A. ovis in vaccinated and control sheep was determined by PCR, represented as Ave ± SD and compared between sheep in the vaccinated farm before and after vaccination and between vaccinated and control sheep by Student’s t-test with unequal variance (*p < 0.05). The time of immunization shots are indicated with arrows.