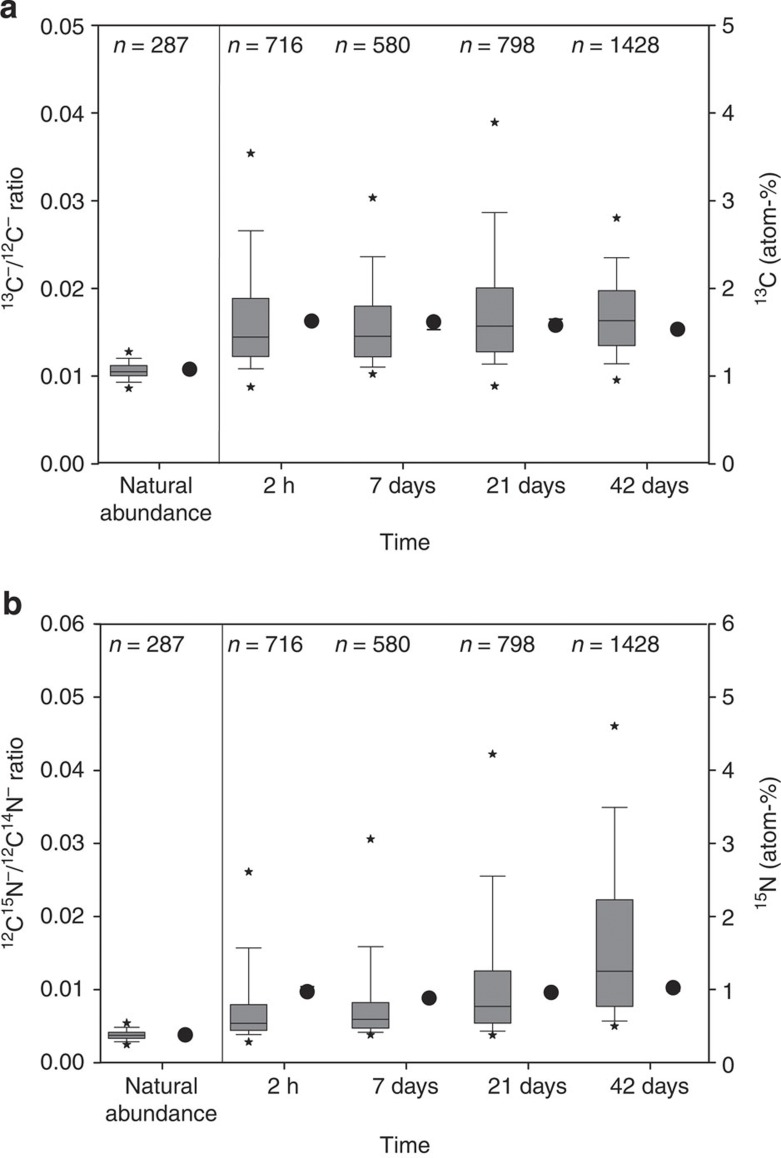
Figure 3. Heterogeneity of newly formed organo-mineral associations.
(a) Box plots of 13C−/12C− ratios obtained by NanoSIMS reflecting the number of evaluated regions of interest (ROIs) (medians, error bars indicate data range within 5th and 95th percentiles) and 13C values (dots) obtained by IRMS (medians, error bars indicate SEs, n=3). (b) 12C15N−/12C14N− ratios obtained by NanoSIMS reflecting the number of evaluated ROIs (medians, error bars indicate data range within 5th and 95th percentiles) and 15N values (dots) obtained by IRMS (medians, error bars indicate SEs, n=3). Outliers are marked with asterisks. The ratios for an unlabelled clay-sized fraction were used to prove enrichment and are called natural abundance.

