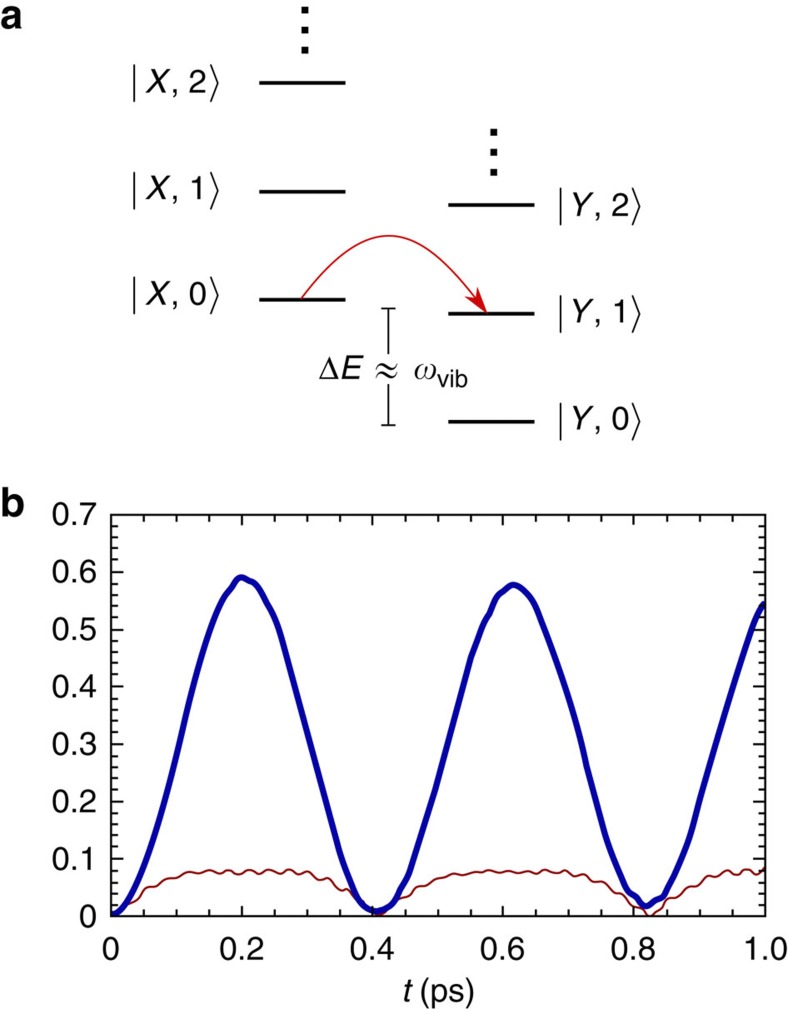
Figure 2. Exciton-collective mode states and free exciton dynamics.
(a) The energy levels of the exciton-collective mode states used to describe energy transfer  . The red arrow denotes population transfer from
  to
to  . (b) Quantum coherent dynamics of the PEB50 dimer in PE545 illustrating population of the lowest exciton ρYY(t) (thick blue curve) and the inter-exciton coherence in the ground-state of the collective mode |ρX0−Y0(t)| (thin red curve).

