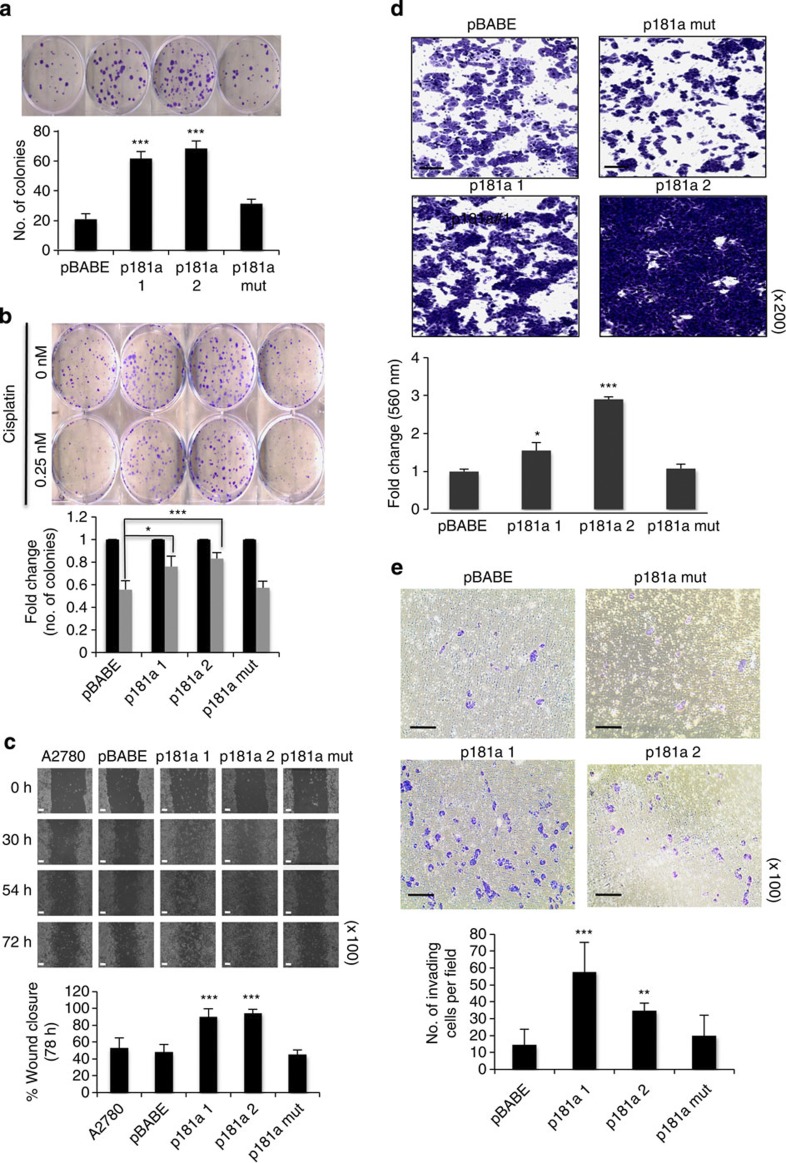
Figure 2. Enhanced expression of miR-181a increases migration and invasion.
(a) Clonogenic assay to assess the effects of miR-181a on cellular survival (b) and response to cisplatin. Colonies are shown in purple post staining with crystal violet (top). Student’s t-test, *P≤0.05, **P≤0.01 and ***P≤0.001 (n=3); NS, not significant. Error bars, s.d. (c) Wound-healing assay (top) to assess the effects of miR-181a on cellular motility by calculating per cent wound closure over time points shown (bottom). Original magnification, × 100, scale bars, 100 μM (white). Student’s t-test, ***P≤0.001 are shown (n=3). Error bars, s.d. (d) Additional assessment of the migratory potential using a transwell migration assay (four panels on top). Original magnification, × 200, scale bars, 50 μM (black). Student’s t-test, *P≤0.05 and ***P≤0.001 (n=3). Error bars, s.d. (e) Transwell invasion assay of miR-181a-expressing cells compared with control cell lines (four panels on top). Original magnification, × 100, scale bars, 100 μM (black). Student’s t-test, **P≤0.01 and ***P≤0.001 (n=3). Error bars, s.d.

