
Figure 1.
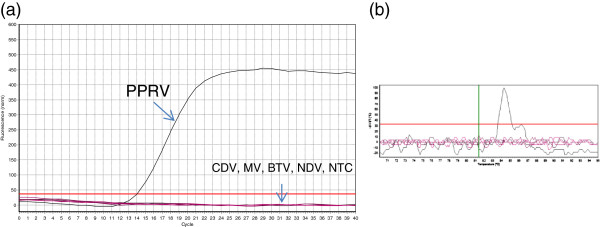
Specificity of N gene based real time RT-PCR. (a) amplification plot representing PPRV, CDV, MV, BTV, NDV and No template control (NTC). (b) Melting curve analysis.
Official websites use .gov
A
.gov website belongs to an official
government organization in the United States.
Secure .gov websites use HTTPS
A lock (
) or https:// means you've safely
connected to the .gov website. Share sensitive
information only on official, secure websites.
Specificity of N gene based real time RT-PCR. (a) amplification plot representing PPRV, CDV, MV, BTV, NDV and No template control (NTC). (b) Melting curve analysis.