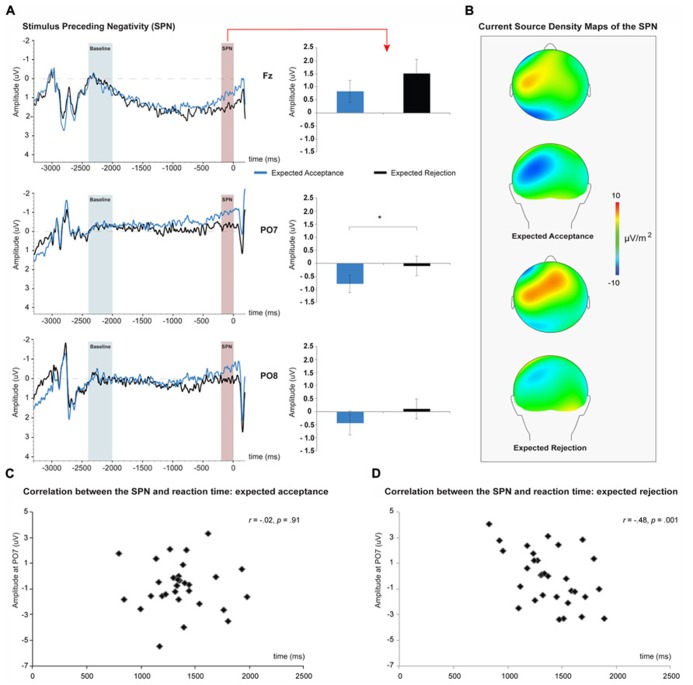
FIGURE 3.
The stimulus preceding negativity (SPN) associated with social-evaluative feedback anticipation. SPN amplitudes were larger for expected social acceptance than for social rejection, and reached peak amplitudes at PO7 (A). Current source density maps show the left posterior dominance of the SPN (B). Correlations between SPN amplitude and reaction time (RT) of the judgments for expected social acceptance (C) and social rejection (D) feedback. An increase in SPN amplitude during expected social rejection was associated with a significant increase in RT of the corresponding judgment. *p < 0.05.

