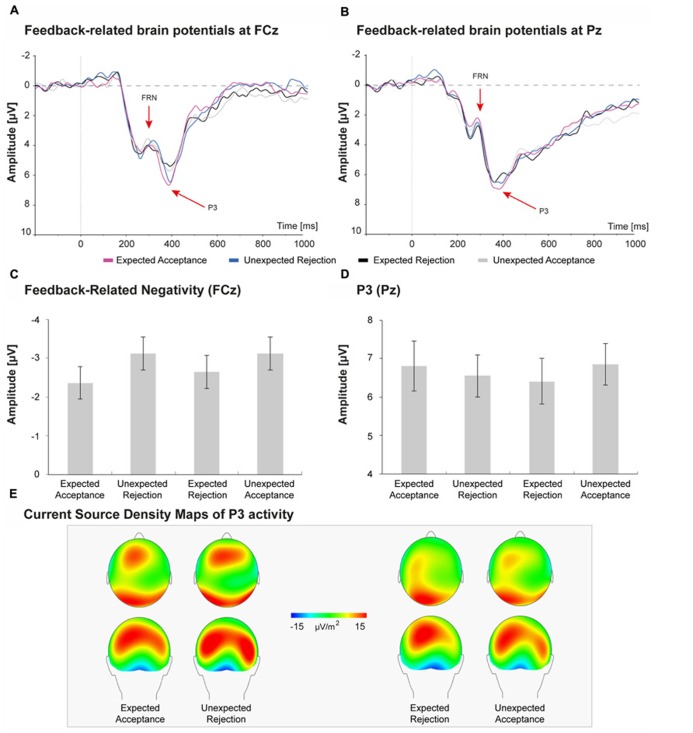
FIGURE 5.
Feedback-related brain potentials elicited by social acceptance and rejection feedback (A,B). FRN amplitudes were largest at FCz (A), whereas the P3 reached peak amplitudes at Pz (B). C,D shows peak amplitudes of the FRN and P3 for the four social-evaluative feedback conditions. The FRN seems sensitive to congruency of feedback; however, this effect was not significant. The P3 seems larger for social acceptance feedback than for social rejection feedback, but also these differences were not significant. E displays the current sources density maps of P3 activity.

