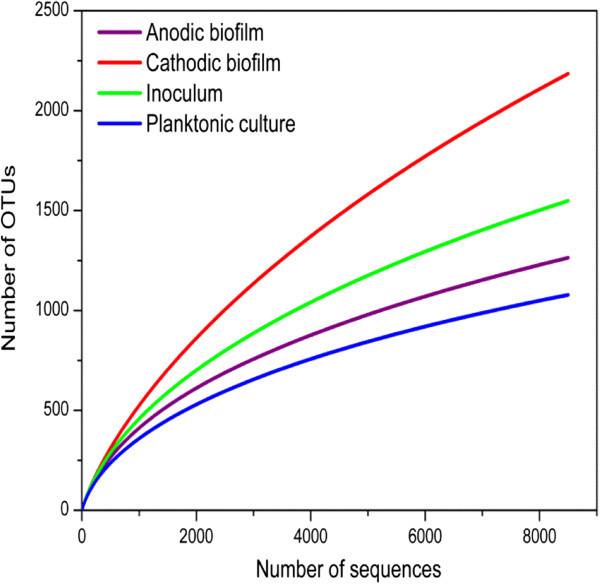
Figure 4.
Rarefaction curves based on pyrosequencing of bacterial communities. Samples were collected from anodic and cathodic samples, and planktonic culture. Inoculum was also analyzed to observe the change in microbial structure after microbial fuel cell operation. The operational taxonomic units (OTUs) were defined at 0.03 distances.

