
Figure 2.
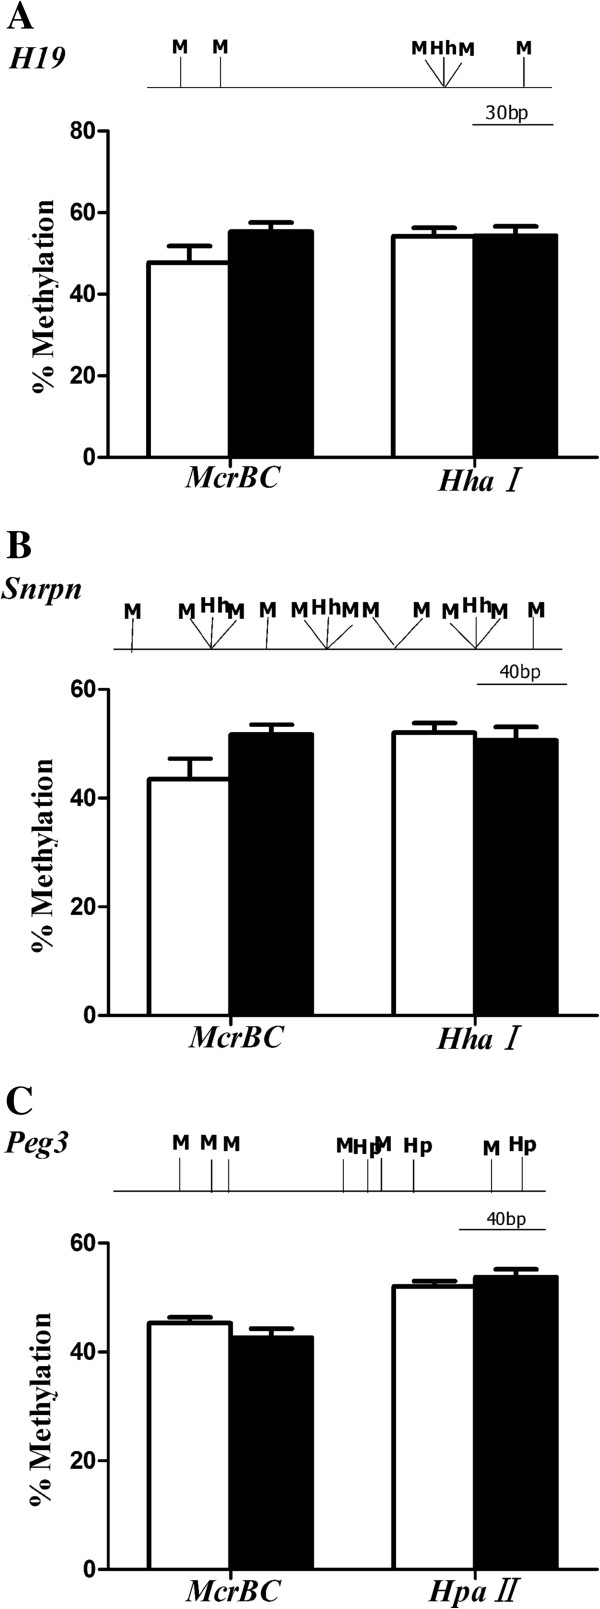
Average DNA methylation levels in DMRs of imprinted genes in 10.5dpc fetus as revealed by qAMP. Diabetic (n = 12 from 4 litters) and control (n = 12 from 4 litters) fetus were collected at 10.5dpc of gestation. DNA was digested with Hha1(Hh), HpaII(Hp) or McrBC (M) and amplified using real-time PCR. The locations of flanked restriction sites were displayed for each DMR. (A) Shown are the average methylation levels of paternally methylated gene H19 DMR; (B, C) represented the DNA methylation status in DMRs of Snrpn and Peg3. Data were presented as mean ± SE for each enzyme employed. White bar, non-diabetic group; black bar, diabetic group.