
Figure 3.
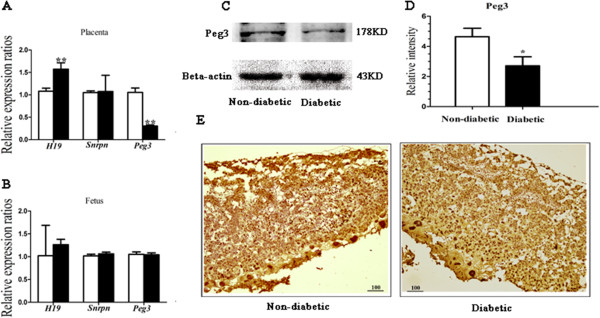
Analysis of the mRNA and protein expression levels of imprinted genes in 10.5dpc placentas and fetus. (A, B) Placentas (n = 30 from 6 litters for each group) and fetus (n = 12 from 4 litters for each group) were collected at 10.5dpc of gestation. Total RNA was purified and reverse transferred into cDNA and then amplified using qRT-PCR. (A) Relative expression levels of H19, Snrpn and Peg3 in placentas. (B) Relative expression levels of H19, Snrpn and Peg3 in fetus. (C) The protein expression of Peg3 in placentas (n = 6) was investigated by western blot analysis and (D) the relative intensity of Peg3/beta-actin was evaluated by gel level analysis. (E) Placentas (n = 6) from diabetic and non-diabetic groups were stained by anti-Peg3 at 1:500 for histological analysis. Scale bar, 100 μm. Data are presented as mean ± SD. White bar, non-diabetic group; black bar, diabetic group; *P < 0.05, **P < 0.01.