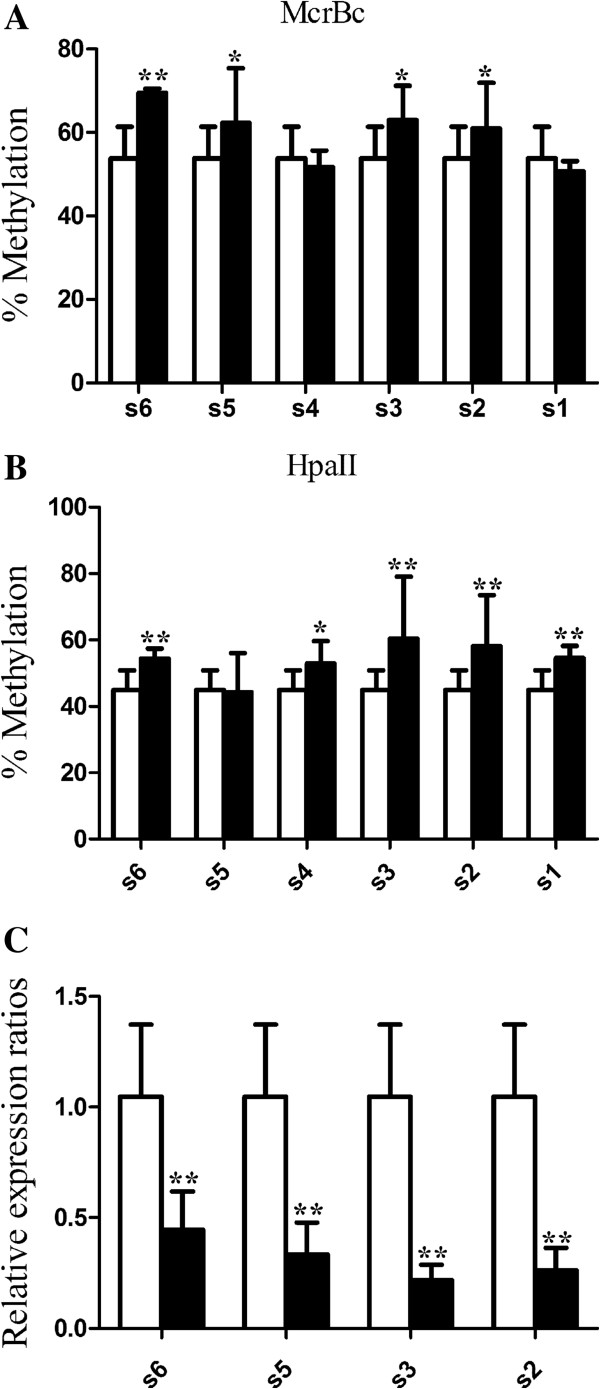
Figure 4.
The methylation level and expression of Peg3 in different litters. (A, B) the methylation level of Peg3 in different litters (n = 6 litters) at McrBc and HpaII was analyzed by qAMP; (C) the expression of Peg3 in s2, s3, s5 and s6 was evaluated by qRT-PCR. White bar, nondiabetic; black bar, diabetic; number and letter under X-axis, litter; *P < 0.05; **P < 0.01.

