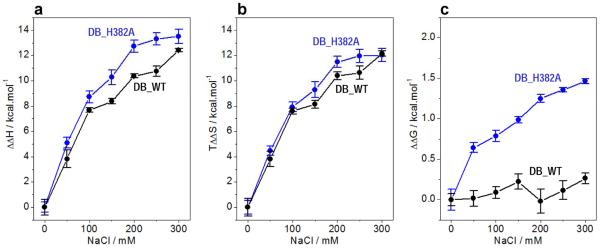
Figure 6.

Comparison of enthalpic (ΔΔH) (a) and entropic (TΔΔS) (b) contributions to the free energy (ΔΔG) (c) with respect to the corresponding contributions in the absence of salt accompanying the binding of ZRE duplex to DB_WT (●) and DB_H382 ( ) domains of EGR1 as a function of increasing NaCl concentration. Note that an increasing value of ΔΔH is indicative of a decrease in the favorable enthalpic contribution, an increasing value of TΔΔS is indicative of an increase in the favorable entropic contribution, and an increasing value of ΔΔG is indicative of a decrease in the overall free energy of binding. The solid lines are merely used to connect data points for clarity. The error bars were calculated from at least three independent measurements to one standard deviation.
