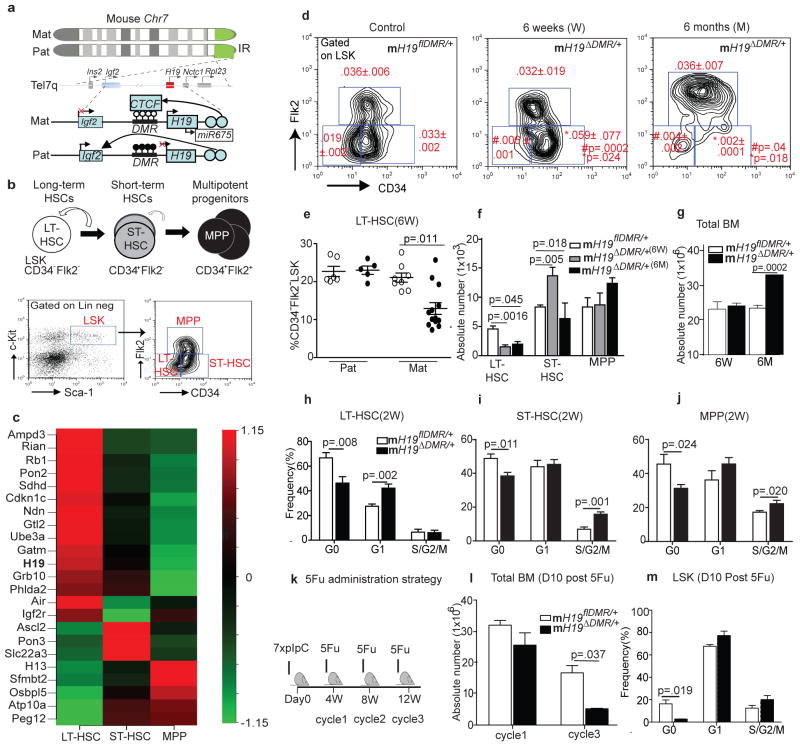
Figure 1. Defective LT-HSC maintenance in mH19ΔDMR/+ mice.
a, H19-Igf2 cluster. Top image- red box, maternally-expressed; blue box, paternally-expressed; gray boxes, genes in the cluster. Bottom image- ○-unmethylated and ●-methylated CpG dinucleotides. X, no expression; arrow, active transcription. b, Upper cartoon- Hierarchical organization. Curved arrow, self-renewal. Lower image: FACS plot. Left panel: gated on Lineage−Sca-1+cKit+(LSK) or right panel: CD34 and FLk2. c, Heatmap of imprinted genes(n=3). d, FACS plot of mH19ΔDMR/+ (n=9) and mH19flDMRl/+(n=8. e, %LT-HSCs of LSK. Absolute numbers of f, HSCs and g, total BM cells. h–j, Cell cycle analysis 2W post-pIpC induction (n=5). k, 5FU cycles. l, Total BM cells(n=3). m, Cell cycle analysis. Error bars, s.e.m.

