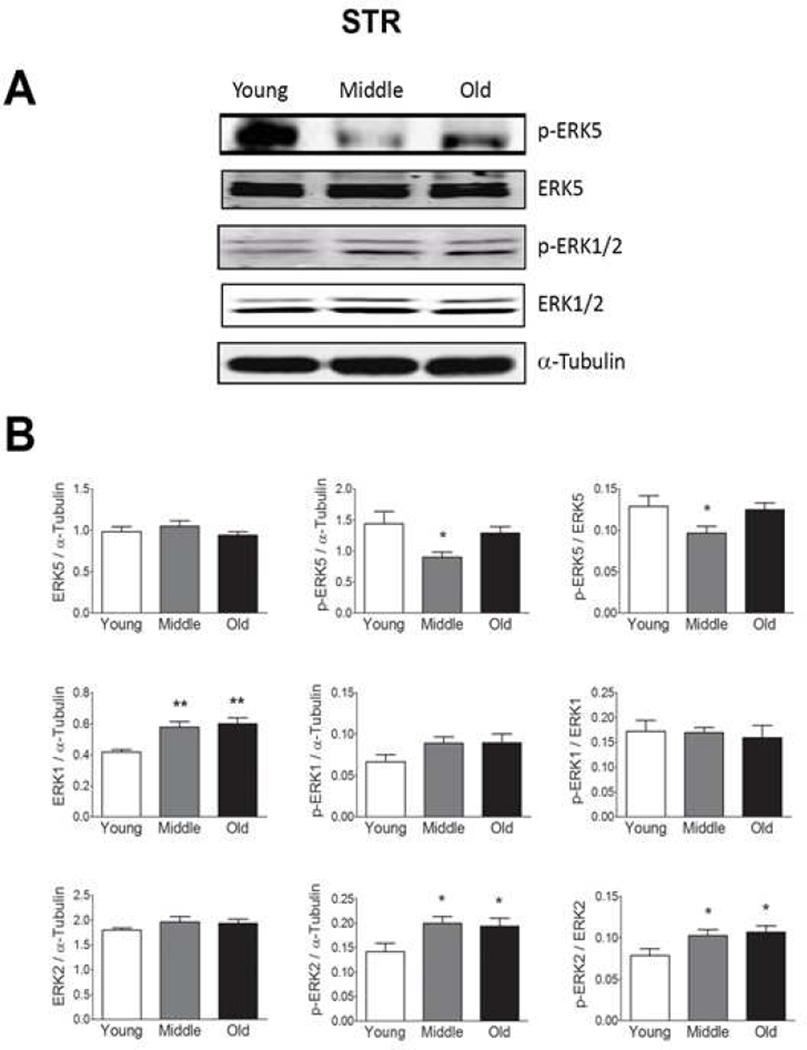
Figure 2. Total and phosphorylated ERK1, 2, and 5 expressions in the striatum (STR) from young, middle and old male F344xBN F1 hybrid rats.
(A) Immunoblot analysis of total and phosphorylated ERK1, 2, and 5 expression in the STR. (B) Quantification of the immunoblots using Licor Odyssey software. The values are calculated using the integrated intensity. Protein expression was standardized to α-Tubulin and basal total protein. n=10 for each age. Data are expressed as mean ± SEM. ** p < 0.01 and * p < 0.05 compared to the young age group by analysis of variance followed by post hoc Student-Newman-Keuls.

