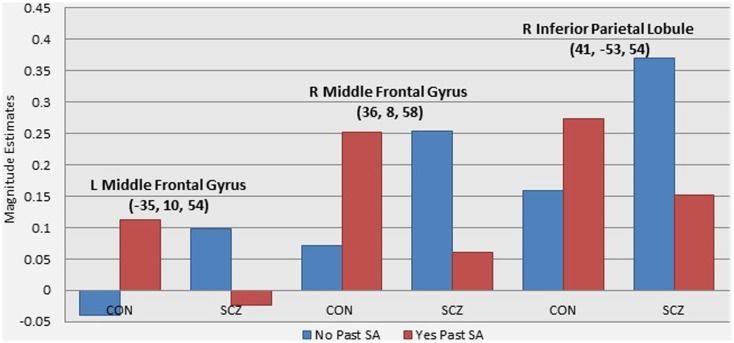
Figure 2.
Graphs illustrating the differential effect of past substance abuse across groups in WM-related brain activity. Note: these graphs present magnitude estimates from follow up analyses of the patterns of activation driving the interaction effect of diagnostic group and presence of past substance abuse. The three regions presented were the only regions to show significant differences between schizophrenia patients with and without past substance abuse (see Table 4).

