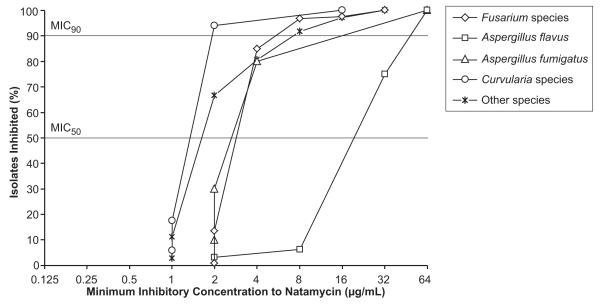
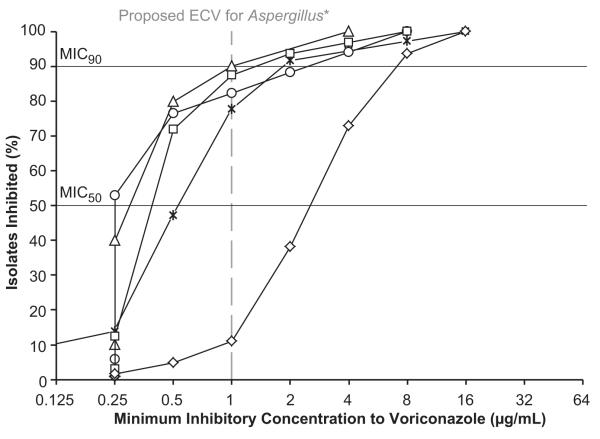
FIGURE. Percentage of Fungal Isolates Inhibited at Different Drug Concentrations in a Fungal Keratitis Clinical Trial.
Percentage of fungal isolates inhibited at increasing concentrations of natamycin (Top) or voriconazole (Bottom). Organisms include Fusarium species (N=126), Aspergillus flavus (N=32), Aspergillus fumigatus (N=10), Curvularia species (N=17), and all other fungal species (N=36). Horizontal black lines represent the threshold for the minimum inhibitory concentration median (MIC50) and 90th percentile (MIC90). *Vertical grey dashed line (Bottom) represents the proposed epidemiological cut-off value (ECV) of 1μg/mL using Clinical and Laboratory Standards Institute methodology for A. flavus and A. fumigatus against voriconazole.38, 39 The ECV distinguishes wild-type strains (exhibit no acquired resistance to the drug in question) from non-wild-type strains.41 Non-wild-type strains have MICs greater than the ECV and may have acquired resistance mechanisms.41


