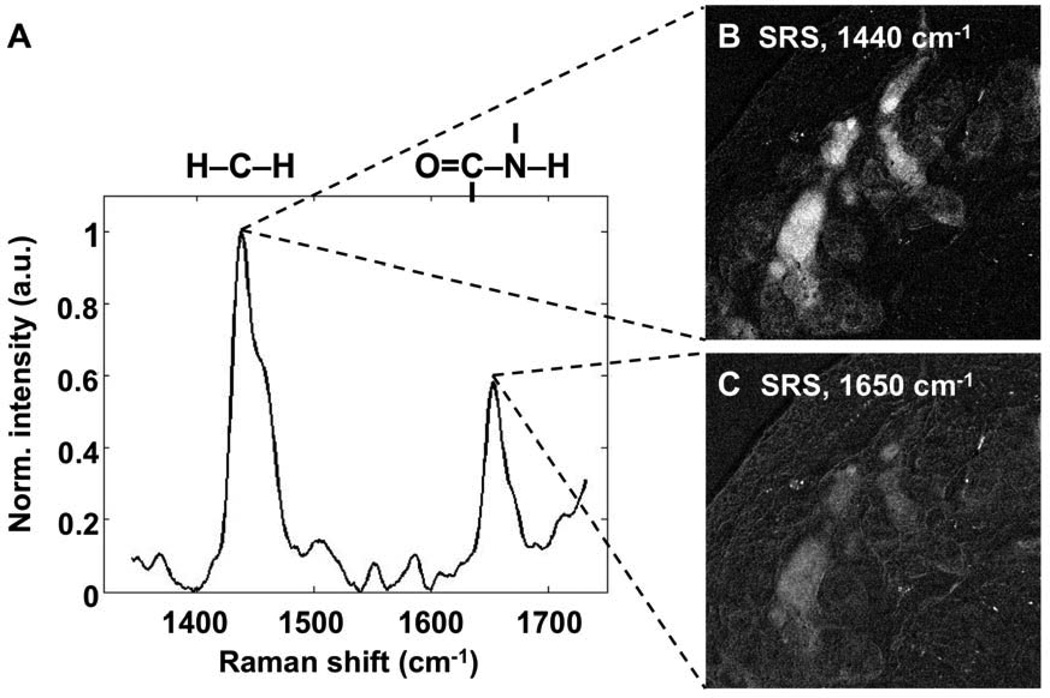
Figure 1.
A) Reference raman spectrum acquired from a single point in mouse meibomian gland. For SRS imaging, two laser beams at different optical frequencies were utilized to probe the vibrational resonance of the CH2 bending (1440 cm−1) and amide-I (1650 cm−1) modes, representing the lipid and protein markers, respectively. Laser beams were scanned through the tissue section via an inverted microscope. Resulting images at 1440 cm−1 and 1650 cm−1 modes are shown in panel B and C, respectively. Protein-to-lipid ratios (P/L) were calculated by dividing the pixel intensities at 1650 cm−1 with intensities at 1440 cm−1. Image width in Panel B and C is 353.5 µm.

