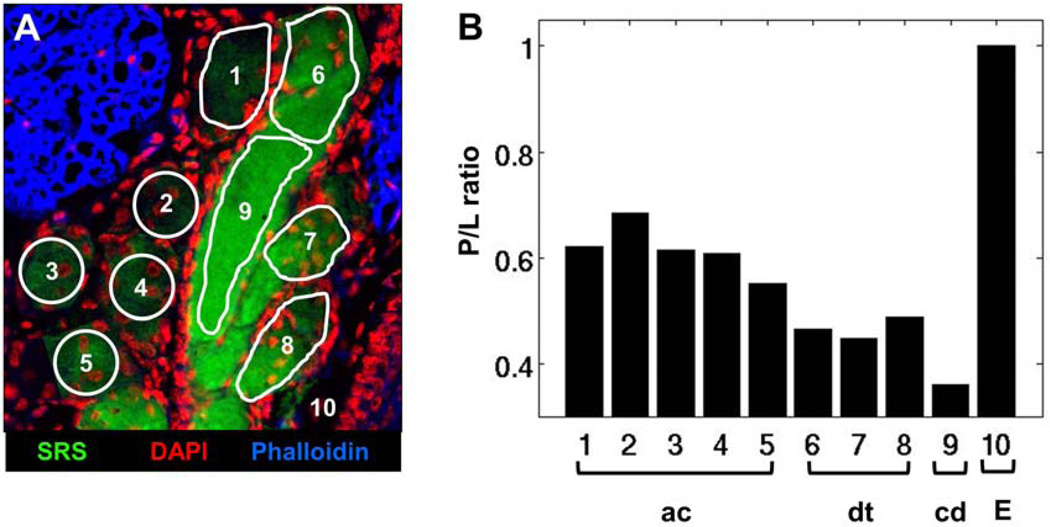
Figure 3.
P/L ratio in meibum of normal, untreated mouse gland. A) Overlay of SRS (green), DAPI (red) and Phalloidin (blue) images of meibomian gland from normal, untreated mouse. B) Protein-to-lipid ratio (P/L) from ROIs highlighted in panel A. The duct and central duct exhibit lower P/L than acini, correlating with the lower level of nuclei-specific DAPI staining. ac, acinus; dt, ductule; cd, central duct; E, extracellular matrix. Image width is 237 µm.

