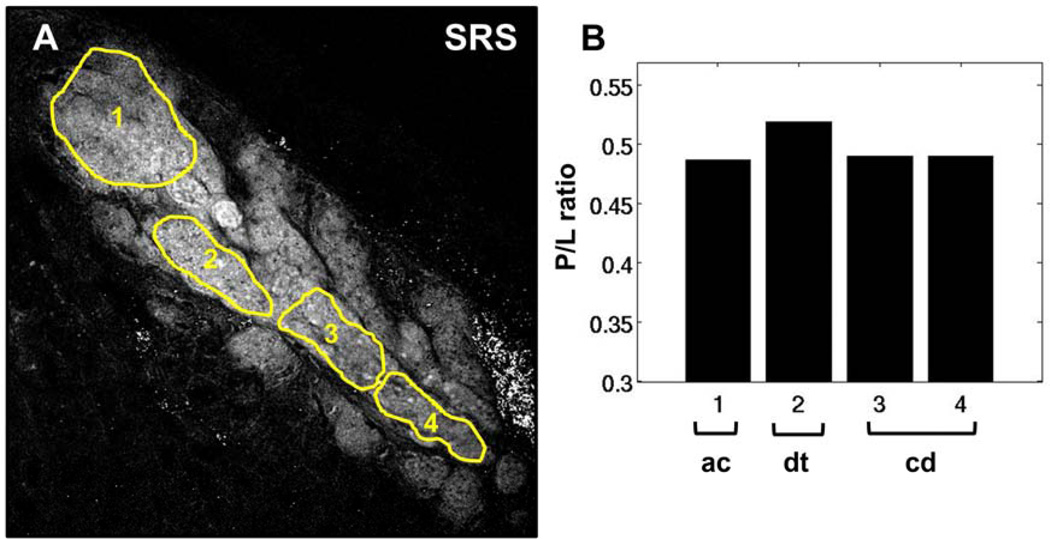
Figure 5.
P/L ratio in meibum of mouse treated in a desiccating stress environment for 5 days. (A) SRS image acquired at the CH2 stretching mode. (B) P/L ratio corresponding to the highlighted ROIs in panel A. The overall P/L trend here differs from the trend observed in the untreated, control mice. ac, acinus; dt, ductule; cd, central duct. Scale bar is 100 µm.

