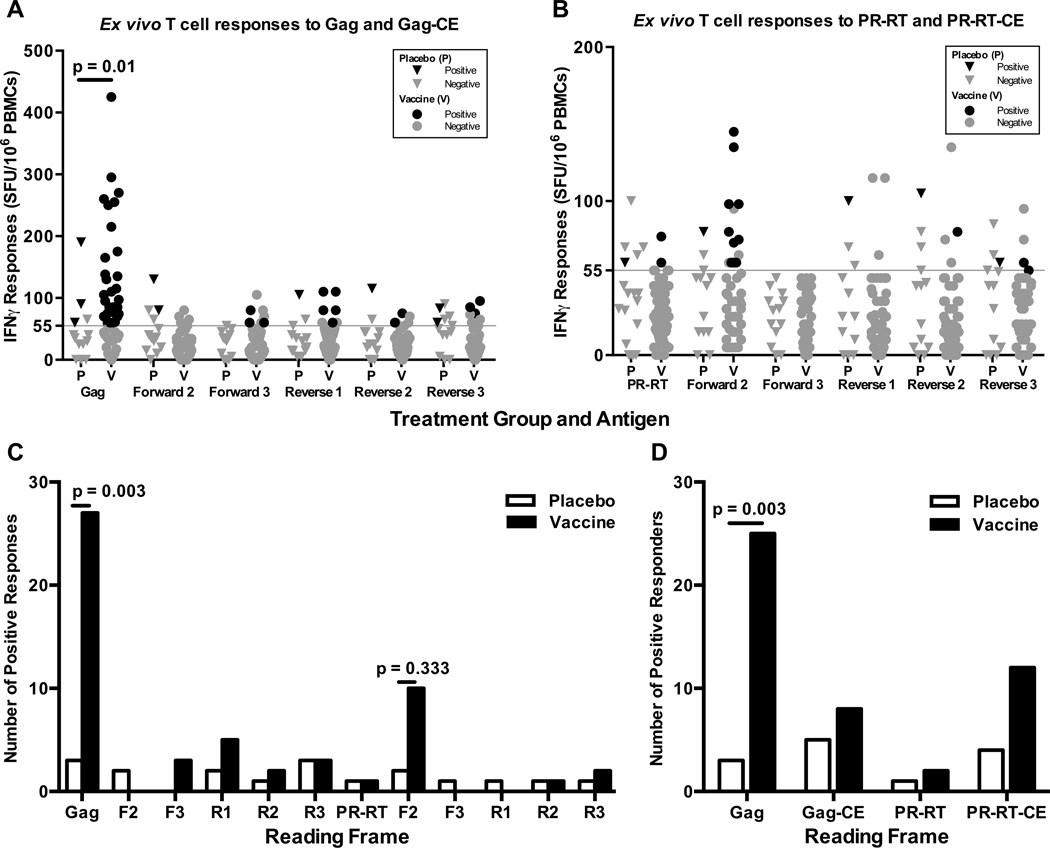
Figure 3. Lack of detectable CE-specific cytotoxic T cell responses to ARF peptide pools.
The magnitude of responses to large, single frame overlapping peptide pools from the gag (A) and PR-RT (B) regions was measured by IFNγ ELISpot. All responses for are shown for positive responders who received vaccine (N= 32; V, circles) or placebo (N=8; P, triangles) treatment during HVTN 205. Positive values (black) exceeded both the positivity threshold (grey line) and 3 times the sample background. (C) The total number of positive responses to 12 large, single frame peptide pools are shown for positive responders according to treatment group. (D) The proportion of participants with a positive response to either protein or any CE encoded by the gag or PR-RT regions is shown as a percentage according to group.

