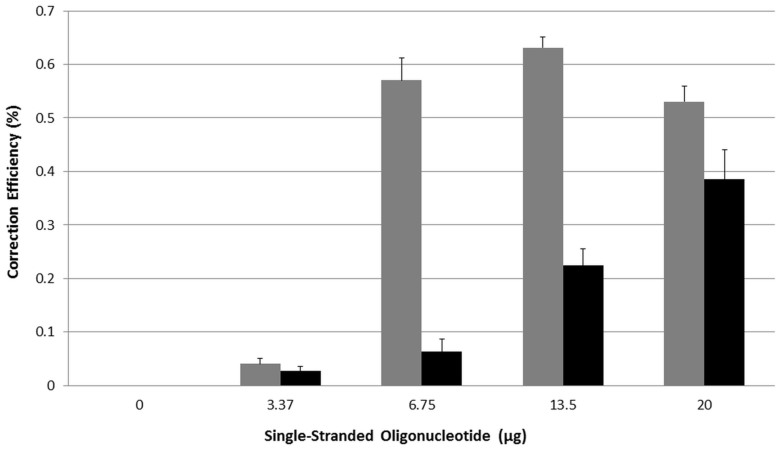
Figure 2. Gene editing dose curve using modified and unmodified ssODNs.
Unsynchronized HCT116-19 cells were electroporated with 0, 3.75, 6.75, 13.5 and 20 ug of 72NT (light gray bars) or 72NT-U (black bars). After a 48-hour recovery period, gene editing activity was measured using a Guava EasyCyte 5 HT flow cytometer. Gene editing is displayed as correction efficiency (%), determined by the number of viable eGFP positive cells divided by the total number of viable cells in the population. Each treatment was performed in triplicate and error bars represent standard error determined by standard methods.

