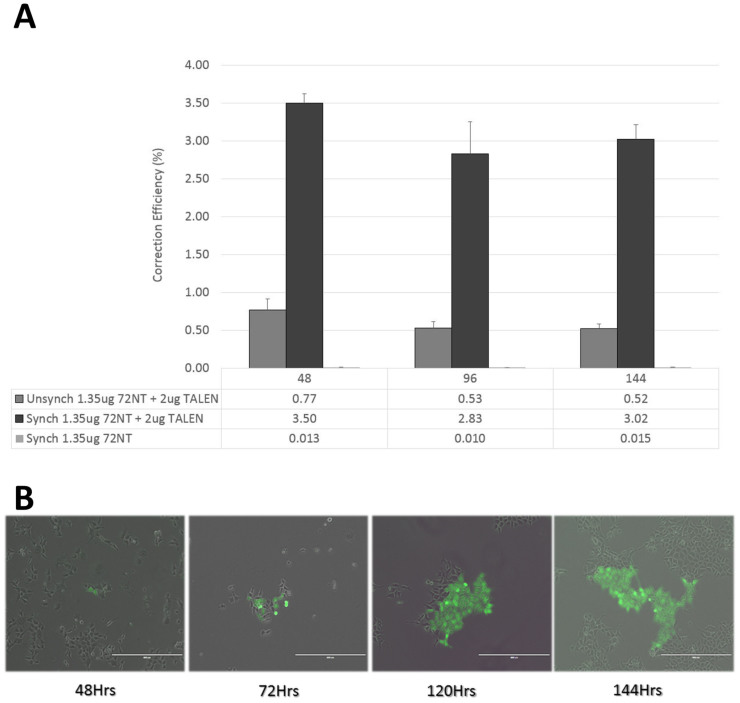
Figure 5. Recovery of corrected cells as a function of time.
Unsynchronized (dark gray bars) and synchronized (black bars) cells were electroporated with 2 ug TALEN and 1.35 ug 72NT. Synchronized and released cells were also electroporated with 1.35 ug of 72NT only (light gray bars). Flow cytometry was used to measure correction efficiency over time at 48, 96 and 144 hours respectively, post-electroporation. Correction efficiency (%) was determined by the number of viable eGFP positive cells divided by the total number of viable cells in the population. Each treatment was performed in triplicate and error bars represent standard error. (B). Transmitted and GFP channel images of HCT116-19 cells were acquired at 48, 72, 120 and 144 hours were merged together to observe the expansion of GFP positive, corrected cells over time. Images were acquired using the EVOS FL (AMG Micro, Bothell, WA) microscope at a magnification of 10×.

