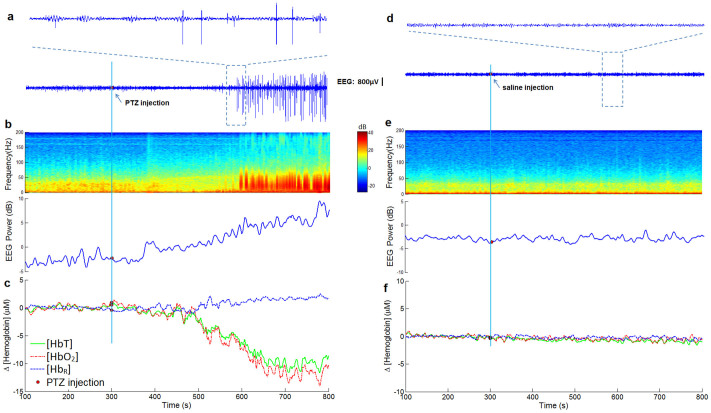
Figure 1. Neural and hemodynamic responses elicited during generalized PTZ-induced seizures.
(a), (b) and (c) are results from seizure experiments of rat #1 with PTZ injection sharing a same time line; (d), (e) and (f) are results from control experiments with saline injection sharing a same time line. The time point of PTZ or saline injection is indicated by the red dots. EEG and hemodynamic traces are picked up at the same location in left M1. (a) Seizure spikes were observed from IEEG recordings after PTZ injection. (b) Obvious power spectral density changes EEG power increase in the fast gamma frequency range (80 ~ 120 Hz) were seen in IEEG time-frequency analysis during seizures. (c) Hemodynamic responses of [HbT], [HbO2] and [HbR] from left M1 induced by PTZ. (d) IEEG recordings in the control experiment. (e) IEEG time-frequency analysis for control experiment. (f) No obvious hemodynamic changes were observed in the control experiments.

