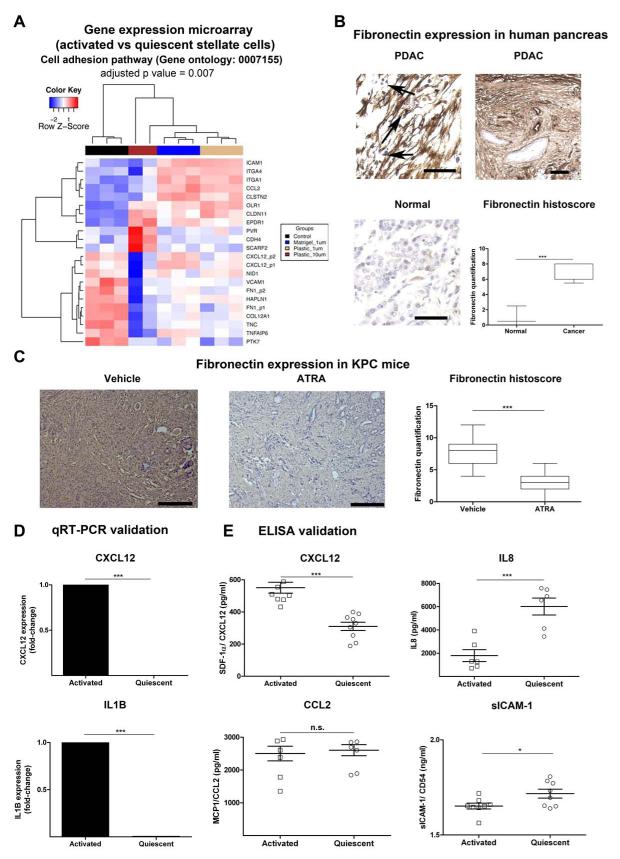
Figure 6. Adhesion molecule and cytokine changes upon activation of PSC.
(A) Re-analysis of gene expression microarrays of qPSC compared to aPSC11 for significantly differentially expressed genes involved in cell adhesion (Gene Ontology GO:0007155) gene set enrichment test = 0.007, performed using DAVID (Benjamini-Hochberg test).19 Hierarchy clustering of all samples (replicates) from four groups, aPSC or control (black) and qPSC under different treatment conditions such as when plated on Matrigel and treated with 1 μM ATRA (blue), when plated on Plastic and treated with 1 μM ATRA (burlywood) and plastic with 10 μM ATRA (dark brown), was performed based on the expression profiles of these differentially expressed probes using the Euclidean metric. Also see Supplementary Figure 14 for the significant changes in gene expression derived from the time-course experiment as well as changes in cytokine-cytokine receptor interaction pathway.
(B) Fibronectin was further assessed in normal human pancreas and human PDAC demonstrating upregulation of fibronectin expression in cancer, particularly in the panstromal compartment where they sequester immune cells (black arrow). Scale bar, 100 μm. Box (median with interquartile ranges (25th and 75th)) and whisker (5th and 95th centiles) plots of fibronectin immunostain is demonstrated. Mann-Whitney U-test.
(C) Upon treatment with ATRA, KPC mice demonstrated a significant reduction of fibronectin deposition. Scale bar, 100 μm. Box (median with interquartile ranges (25th and 75th)) and whisker (5th and 95th centiles) plots of fibronectin immunostain is demonstrated. Mann-Whitney U-test.
(D) qRT-PCR demonstrated significant alteration of some of the transcripts identified by gene-expression microarray analysis. Other transcripts have been studied before.11 Bar chart represents mean ± SEM. Paired t-test; p values are two-tailed.
(E) Concentrations of the proteins in conditioned media collected from qPSC and aPSC using ELISA. Surprisingly at protein level, there was no/little difference in secretion between qPSC and aPSC for sICAM1/ CD54 and MCP1/ CCL2. However, confirming the gene expression data, aPSC secreted less IL8 than qPSC and the reverse was true for SDF-1α/ CXCL12. Summary data represents mean ± SEM. Paired t-test; p values are two-tailed.

