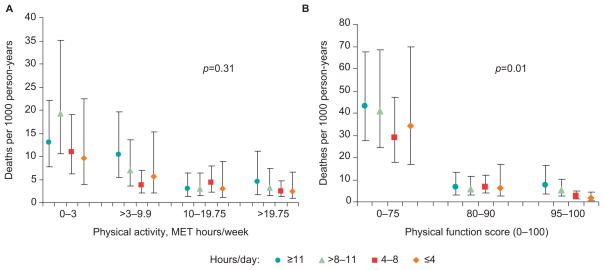
Figure 2.
Age-adjusted death rates per 1000 person-years according to category of sedentary time, stratified by level of physical activity (A) and physical function (B). p-values indicate effect modification of relationship between sedentary time and mortality risk by (A) METs of moderate to vigorous physical activity (MVPA) and (B) SF-36 physical function score

