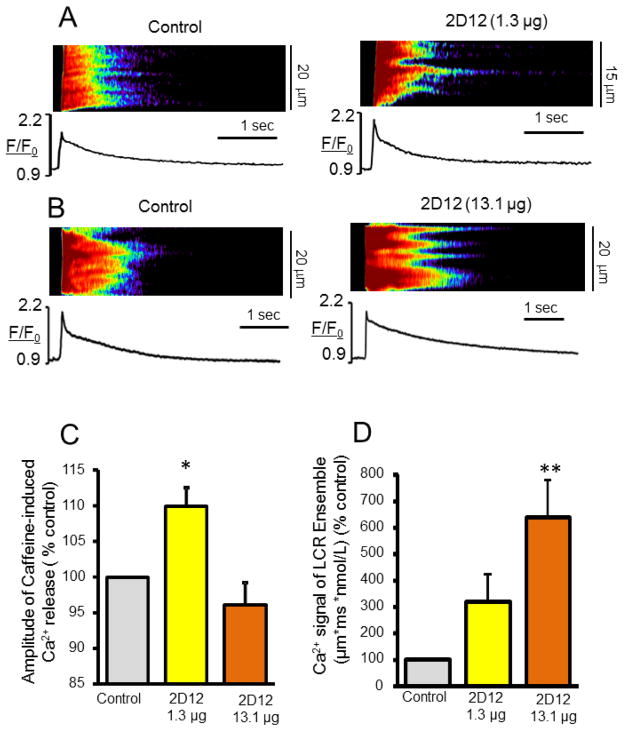
Fig. 8.
The relationship of the magnitude of the summated Ca2+ signal of spontaneous partially synchronized local Ca2+ releases (LCR’s/wavelets) to the amplitude of the cell-wide caffeine-induced SR Ca2+ release. (A, B) Representative confocal images and caffeine-induced Ca2+ transients elicited by 20 mM caffeine in permeabilized VM in control conditions bathed in 100 nM [Ca2+] (left) and after 2 min treatment with 2D12 (1.31μg/1ml and 13.1μg/1ml) (right). (C, D) Average changes in the amplitudes of the caffeine-induced SR Ca2+ release (n=6 to 18 cells for each data point) and Ca2+ signal of the LCR ensembles (n= 6 cells for each data point) in permeabilized VM in control and after application of a low (1.31μg/1ml) or a high (13.1μg/1ml) concentration of 2D12. *P < 0.05, **P < 0.01.

