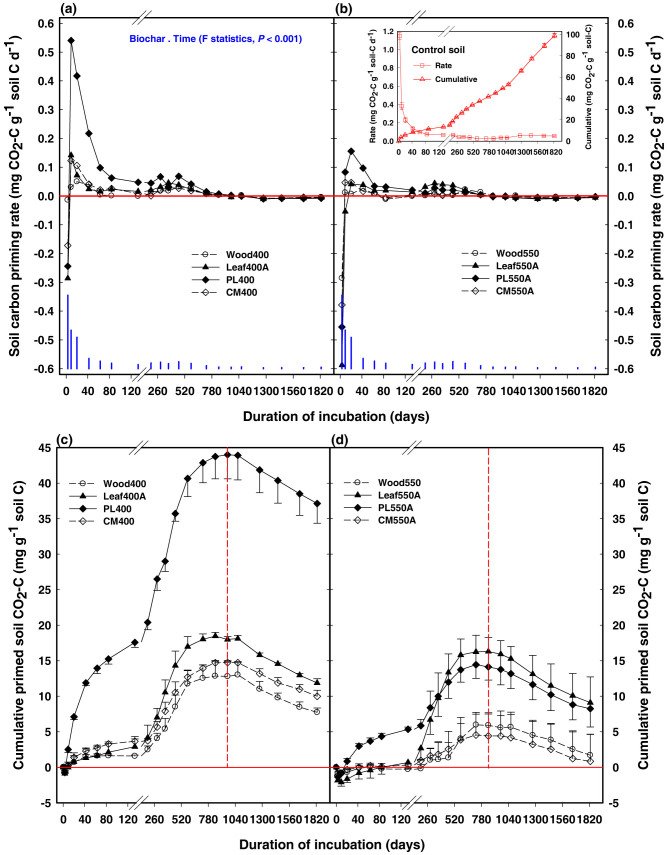
Figure 1. Soil carbon priming rate (upper panel) and cumulative amount of positively-primed carbon (lower panel) per gram of soil carbon over 5 years in the presence of 400°C (Fig. 1a,c) and 550°C (Fig. 1b,d) biochars in Vertisol.
The main graphs (Fig. 1a–d) are plotted relative to control. Blue bars in Fig. 1a,b show least significant differences (at 5% level, LSD0.05). Error bars for the cumulative data represent 1 standard error (SE) of the means (n = 3). Treatment details are given in Methods. The inset in Fig. 1b shows the mean values (±SE) of both rates and cumulative amounts of carbon mineralised in the control soil (The x-axis title of the inset is the same as for the main graphs). Note the change of scale after the break on the x-axis (i.e. duration of incubation). The dashed vertical line in Fig. 1c,d represents the initiation of a period in which the amount by which mineralisation of native SOC exceeded that of control (positive priming) gradually diminished.

