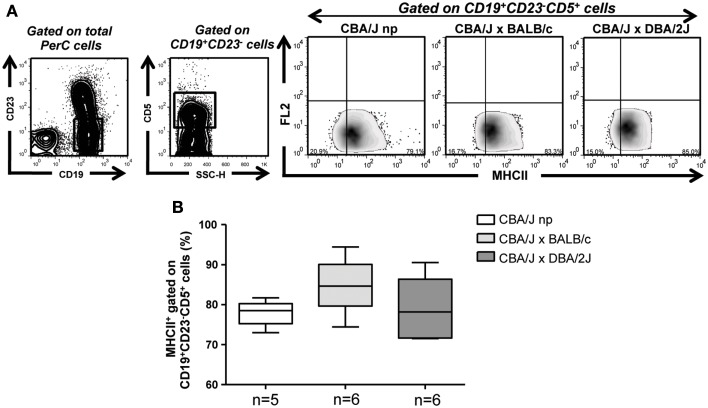
Figure 4.
B-1a B cells from pregnant animals developing normal pregnancies and animals suffering pregnancy disturbances display similar levels of MHCII expressing B-1a B cells. (A) Representative contour and density plots displaying the gating strategy used to analyze the percentages of MHCII expressing CD19+CD23−CD5+ B-1a B cells in the PerC of non-pregnant and pregnant mice. (B) Graph depicts percentages of MHCII expressing CD19+CD23−CD5+ PerC B-1a B cells from non-pregnant as well as BALB/c (normal pregnant) and DBA/2J (pregnancy disturbances) pregnant CBA/J females. Data are expressed as Box and Whisker plots showing median. Differences were analyzed by the non-parametric Kruskal–Wallis test.

