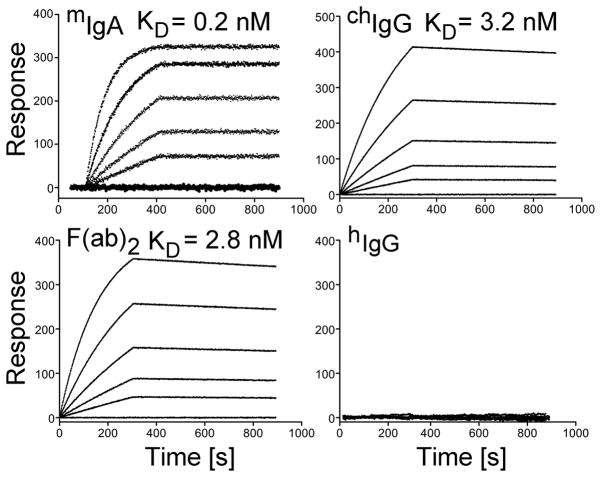
Figure 4.
Kinetics of the binding of the anti-α2Ct antibody variants to procollagen I. In each panel, the curves represent association and dissociation events during analyzed binding interactions between procollagen I and antibody variants present at concentrations ranging from 12.5 nM to 200 nM. For each assay, the association rate constants (kon) and the dissociation rate constants (koff) were obtained, and the equilibrium dissociation constants (KD) values were calculated from a ratio of koff/kon.

