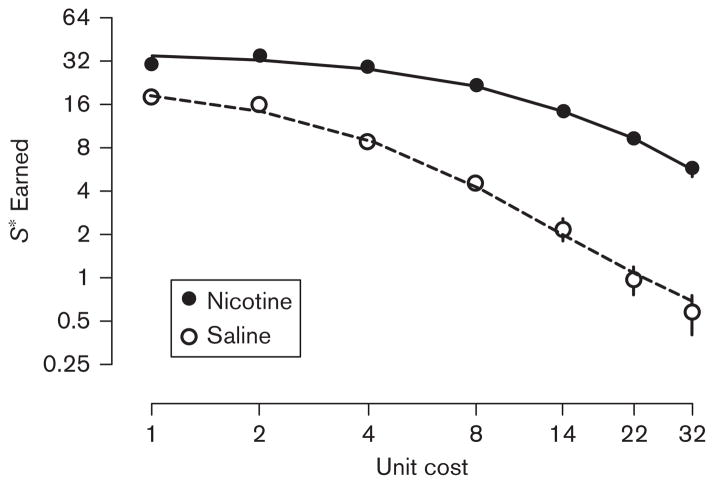
Fig. 2.
Number of visual stimulus presentations earned between nicotine and saline administration conditions as a function of fixed-ratio schedule (unit cost). The filled and open circles represent data from the nicotine and saline administration sessions, respectively, averaged over the last three sessions of each type. The solid and dashed lines represent the predicted values of the reinforcer demand model when fit to the mean data from the nicotine and saline conditions, respectively. Note that both axes are plotted in logarithmic space.

