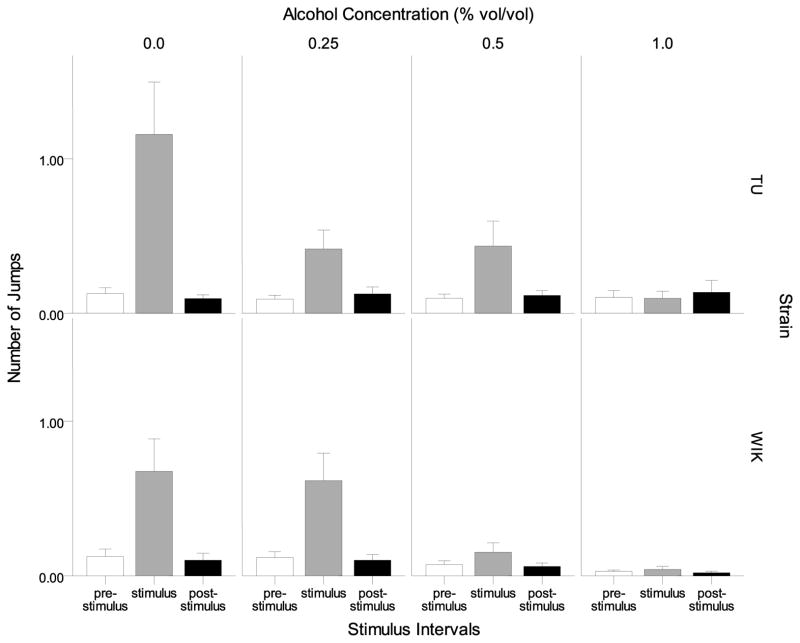
Figure 11.
Number of jumps during intervals prior to the stimulus presentation (pre-stimulus), during the stimulus (stimulus), and after the stimulus (post-stimulus) is shown for each alcohol concentration and strain. Means ± S.E.M. are shown. Note the increased number of jumps during the stimulus interval, and the reduction after alcohol exposure.

