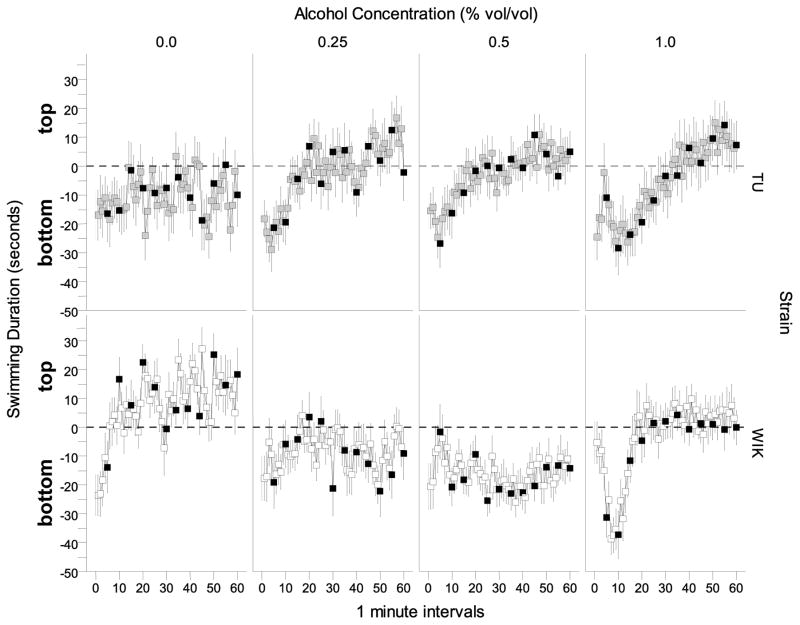
Figure 4.
The difference between top vs. bottom swimming duration (top duration minus bottom duration) measured over a 60 minute period is dependent on strain and alcohol concentration. Positive values represent greater time swimming near the top compared to bottom and negative values represent greater time swimming near the bottom compared to top for each 1 minute interval. Means ± S.E.M. are shown. Values obtained for TU zebrafish during the no stimulus periods are represented by the light grey squares and values obtained for WIK zebrafish during the no stimulus periods are represented by the white squares. Values obtained for stimulus periods are shown in black. The dashed line represents the middle of the tank. Values above this line show time spent in the top half and values below this line show time spent in the bottom half of the tank.

