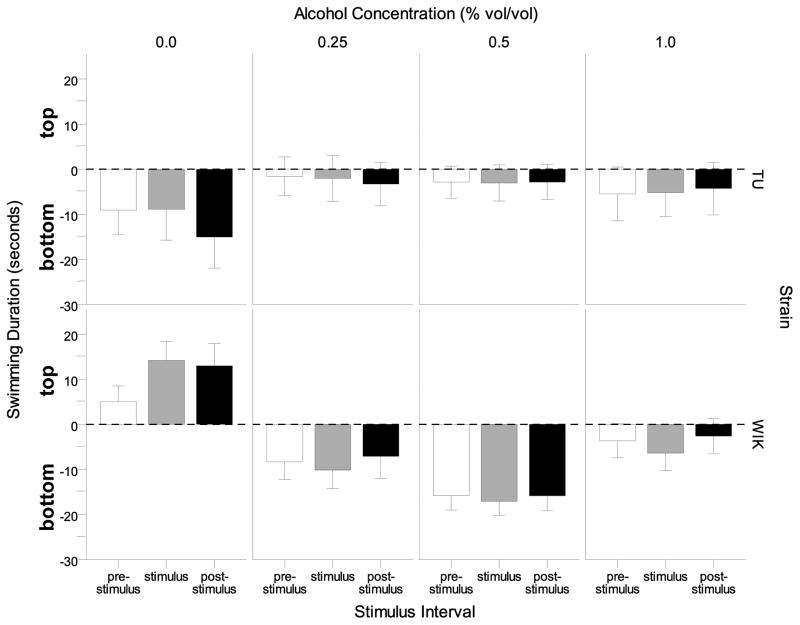
Figure 5.
The difference between top vs. bottom (top duration minus bottom duration) swimming duration during intervals prior to the stimulus presentation (pre-stimulus), during the stimulus (stimulus), and after the stimulus (post-stimulus) are shown for each alcohol concentration and strain. Positive values represent greater time swimming on the top compared to bottom and negative values represent greater time swimming on the bottom compared to top for each stimulus interval. Means ± S.E.M. are shown.

