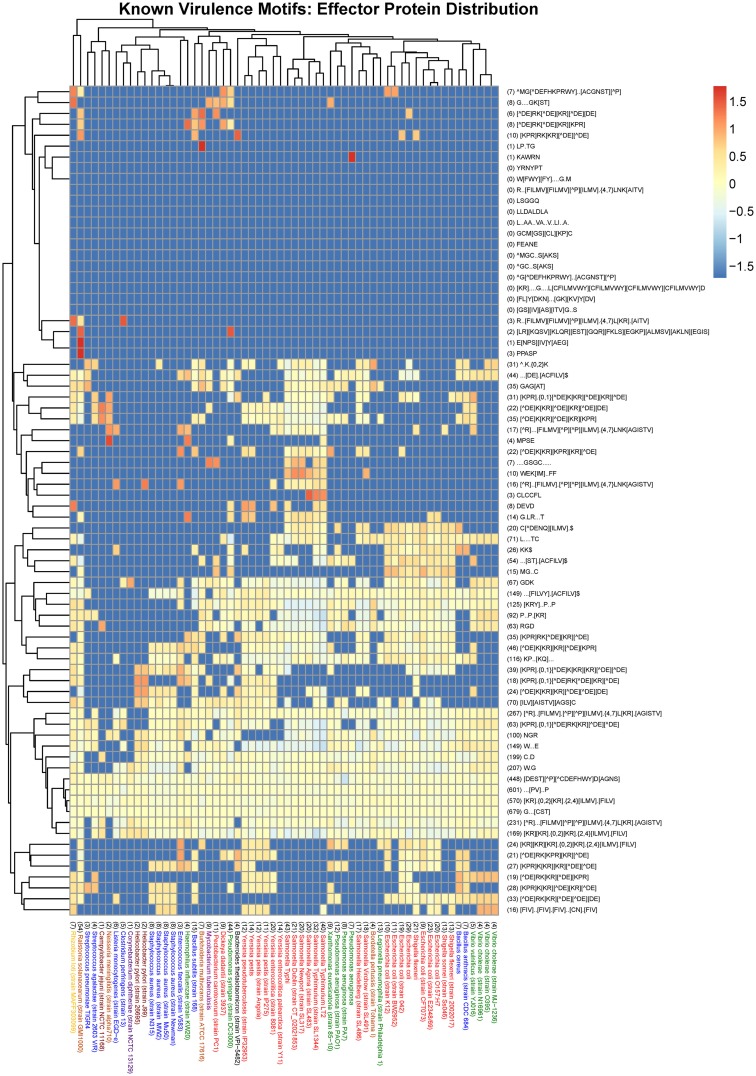
Figure 3.
Heat map visualization of the distribution of known virulence motifs amongst effector proteins from a selection of 60 organisms represented in the MvirDB. Columns: The bacterial species name with the total number of UPCs indicated in brackets at the start of the description. Purple, High GC Gram+ bacteria; Blue, Firmicutes; Yellow, a-proteobacteria; Light Brown, b-proteobacteria; Dark Brown, e-proteobacteria; Green, g-proteobacteria (non-enterobacteria); Red, g-proteobacteria (enterobacteria); Black, others (CFB). Rows: The motif regular expression with the total number of incidences in UPCs across all 60 organisms indicated in brackets at the start of the description. Color scale: The logarithm of the normalized N_UPC returned from the SLiMSearch results.

