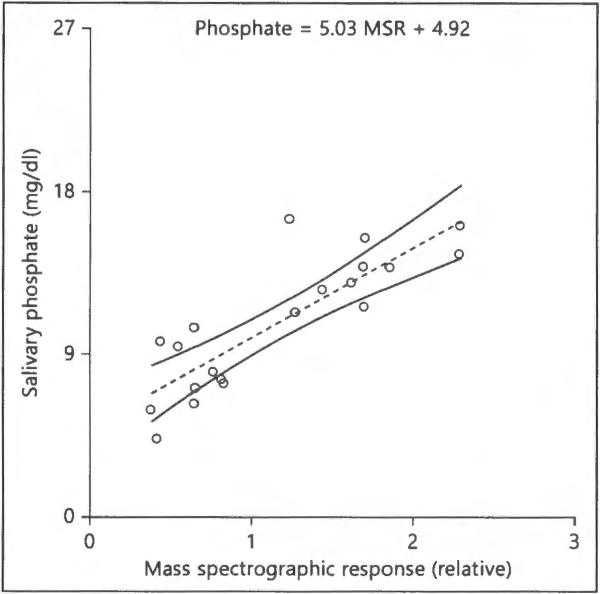
Fig. 3.
Least-squares fit linear function and 95% CIs. The relationship has an r2 of 0.72 and a p < 0.0001 for prediction of phosphate from the spectrographic response by the function phosphate (mg/dl) = 5.03 MSR + 4.92. Thus, the median mass spectrographic value for saliva of 1.0 would be 9.95 mg/dl.

