
Figure 9.
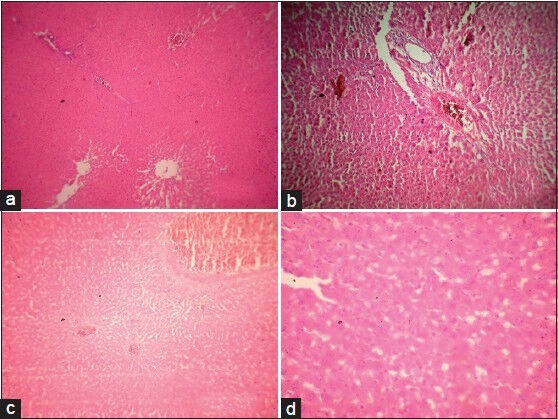
(a) Microphotograph of liver from normal rat (group 1), (b) Microphotograph of liver from diabetic rat (alloxan) (group 2), (c) Microphotograph of liver from diabetic rats treated with AEMD (group 3), (d) Microphotograph of liver from diabetic rats treated with glibenclamide (group 4)