
Figure 4.
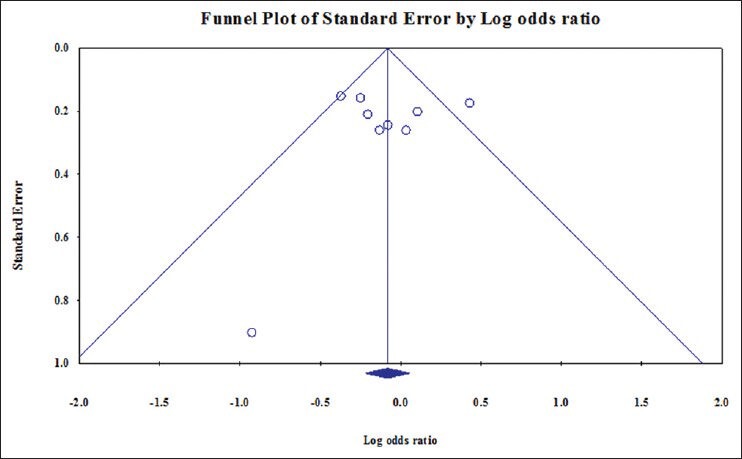
Begg's funnel plot analysis for the comparison of the TG versus GG alleles of SNP + 276. P value of Begg's test was 0.75 (continuity corrected)
Official websites use .gov
A
.gov website belongs to an official
government organization in the United States.
Secure .gov websites use HTTPS
A lock (
) or https:// means you've safely
connected to the .gov website. Share sensitive
information only on official, secure websites.
Begg's funnel plot analysis for the comparison of the TG versus GG alleles of SNP + 276. P value of Begg's test was 0.75 (continuity corrected)