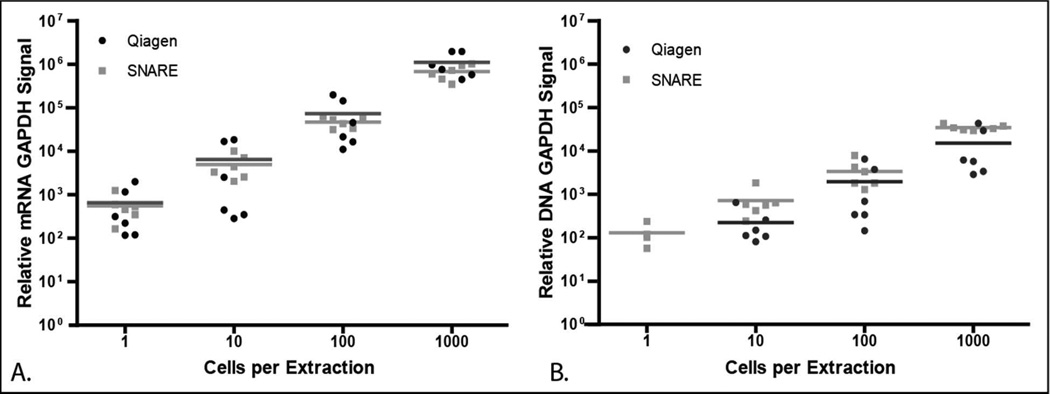
Figure 4.
Comparison of A) relative GAPDH mRNA, and B) GAPDH DNA signal purified from 1000, 100, 10 or 1 LNCaPs using SNARE (grey dots) or Qiagen (black dots). Each dot represents a nucleic acid purification procedure with horizontal lines representing the mean of the individual experiments. Sample size per a group n=6.

