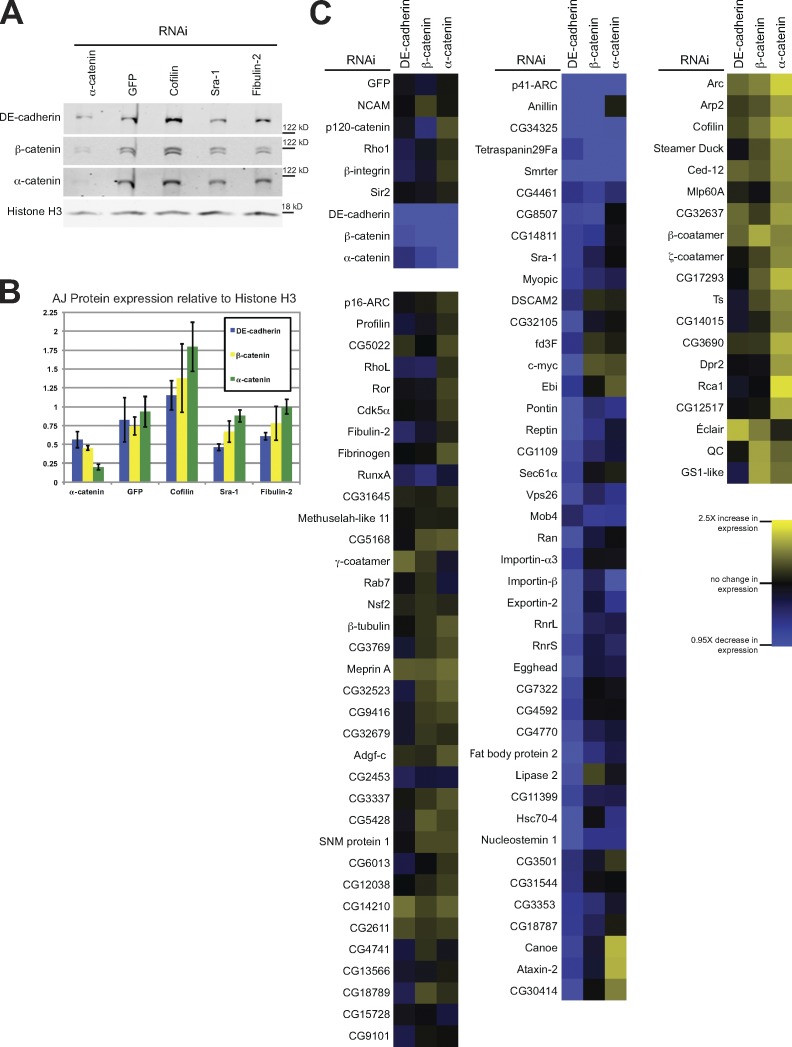
Figure 3.
Cadherin–catenin levels in DECAD-S2 cell knockdowns. (A) Western blot showing DE-cadherin, β-catenin, and α-catenin expression in different knockdowns. Hashes indicate molecular mass standards. (B) Quantification of three Western blots showing percent expression of the indicated proteins relative to histone H3. Error bars show SEMs for three independent experiments. (C) DE-cadherin, β-catenin, and α-catenin protein levels were calculated relative to histone H3 expression and averaged across three samples, and the deviation in expression from GFP controls was imaged in TreeView.

